Consider this: over the past five years nearly $78 billion has been invested in digital health companies and yet just this past year over 20 million Americans were taken off the Medicaid rolls. Certain policy changes can be very damaging, to say nothing of other human-induced factors like pollution, climate change, wars, inadequate housing and education, and hunger which have staggering implications on health. At times it can feel like bailing water out of a sinking ship. These issues can negate years of innovation (and investment), exacerbating the profound issues of cost and access. Is it all worth it? Arguably, yes, as technology is the great democratizing force in healthcare and should create a rising tide.
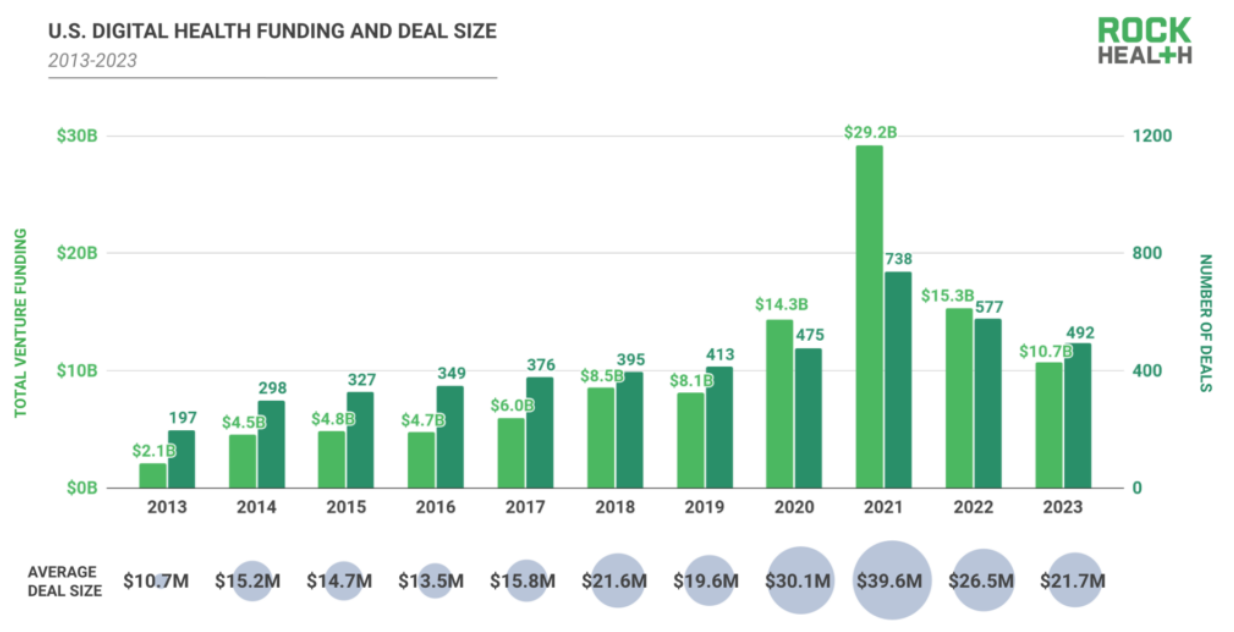
The opportunities to “transform the business of healthcare” (Flare Capital’s tag line) remain obvious and acute, notwithstanding that the level of investment activity has receded from the $30 billion highwater mark in 2021 to a more manageable $10 – $12 billion annual pace. Healthcare technology now represents approximately 8% of all venture capital investments. Just as important is the number of companies funded which is trending back to 400 – 500 companies per year, implying that round sizes have decreased dramatically to ~$20 million, according to data from Rock Health.

Source: Rock Health
Arguably, the 2021 hangover still lingers in the healthcare technology sector as companies that raised too much capital at too high a price work to sort out challenging cap tables. Out of the 2021 mosh pit of too many companies, it appears that the sector is in an “Emerging Winners” phase that will drive companies with narrow and/or incomplete offerings to combine or shut down. In general, financing rounds provide 15 – 18 months of runway, implying that maybe a company can raise ~3 years of capital before having to really make the call on its true prospects. This would put us squarely in the 2024 window. Rock Health flagged that 44% of all 2023 financing rounds were “unlabeled,” suggesting a high proportion of insider bridge extensions to buy a few more quarters.
This is not just a healthcare technology phenomenon. The overall venture capital activity in 1Q24 was a relatively muted $36.6 billion across 2,882 companies for an average round size of $12.7 million, as compared to $51.6 billion and 4,026 companies in 1Q23 according to a recent NVCA/Pitchbook analysis. This more defensive posture is expected given the continued and prolonged reduction in exit activity. For 1Q24, exits totaled a modest $18.4 billion across 223 transactions, approximately half of the value of new investments but a mere 8% of total companies funded, suggesting an ecosystem still out of balance. Some additional context: total assets under management by venture capital firms is $1.2 trillion.

Source: NVCA/Pitchbook
While venture investment quarter-over-quarter was modestly down ($40.1 billion in 4Q23 versus $36.6 billion in 1Q24), the number of companies that raised capital declined by 575. Both Early and Late Stage activity were relatively flat, and together accounted for 63% of the number of financings, while the Growth Stage dropped by $4.8 billion. Ironically, even employees wanted to hold less equity in venture-backed companies. According to an analysis of 43k companies by Carta, employees held 37% less equity in those companies as compared to 18 months ago, while salaries were largely unchanged.
A significant contributor to this downdraft was the decline in “mega rounds” (over $100 million). While less than 3% of all financings, “mega rounds” accounted for 47% of the capital deployed with an average round size in 1Q24 of $226 million versus $298 million in 4Q23. Surprisingly, there were 37 newly minted unicorns in 1Q24, which was 48% greater than 4Q23. The level of “first-time financings” materially dropped from $4.0 billion in 1,242 companies in 1Q23 to $3.1 billion in 827 companies in 1Q24, perhaps reflecting greater risk aversion to back first-time founders.
This deceleration is not unique to the U.S. as global venture investment activity declined 30% in 1Q24, according to analysis by Preqin, with China declining by 40%. The total amount invested was $57.8 billion, the lowest quarterly pace since 2017. Were it not for the AI frenzy, these numbers would likely be lower still.
As capital became more expensive and harder to access over the last three years, median round sizes declined meaningfully across all stages but with the greatest 1Q24 decline for Growth Stage companies, now only registering an unbelievable $5.7 million. While the trends are similar, the average Growth Stage round size in 1Q24 was much greater at $31.8 million, reflecting the impact of the “mega rounds.”

Source: NVCA/Pitchbook
Arguably, the more interesting analysis is the impact on median pre-money valuations by stage. After a precipitous drop from 2021 to 2023 for Growth Stage financings ($400 million to $144 million), there are signs of life in 1Q24, notwithstanding the reduced level of overall investment activity. Across all stages there has been a sharp increase in median pre-money valuations, with the Growth Stage coming in at $229 million, which almost looks to be a typo. Notwithstanding that, Carta estimated that 20% of all financings in 2023 were “down rounds.”

Source: NVCA/Pitchbook
Liquidity makes the venture capital world go round. Sadly, that part of the narrative has stalled with an estimated 300 exit transactions totaling $18.4 billion (average deal size of $61 million), which is tricky when compared to the pre-money valuations. Pitchbook now estimates that there are 55k venture-backed companies with the average age of Growth Stage companies at 13.1 years; Late Stage companies are on average 9.5 years old. Bain & Co recently reported that there are 28k private equity portfolio companies that are worth $3.2 trillion. In 2023, the value of exited companies by private equity firms declined by 44% from 2022, the lowest level in a decade.
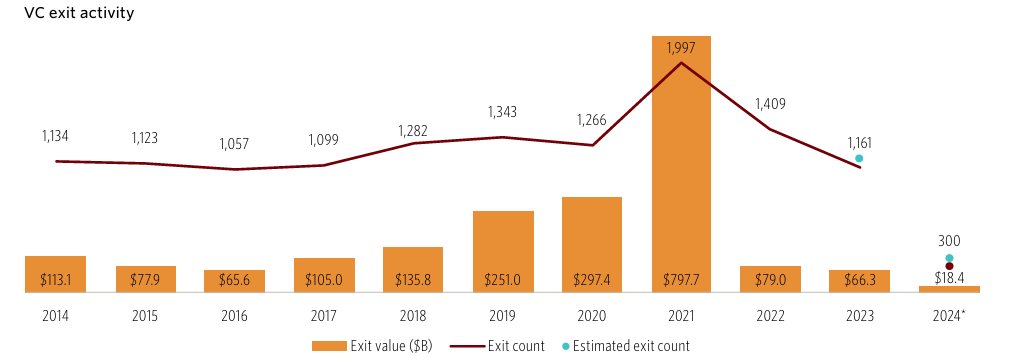
Source: NVCA/Pitchbook
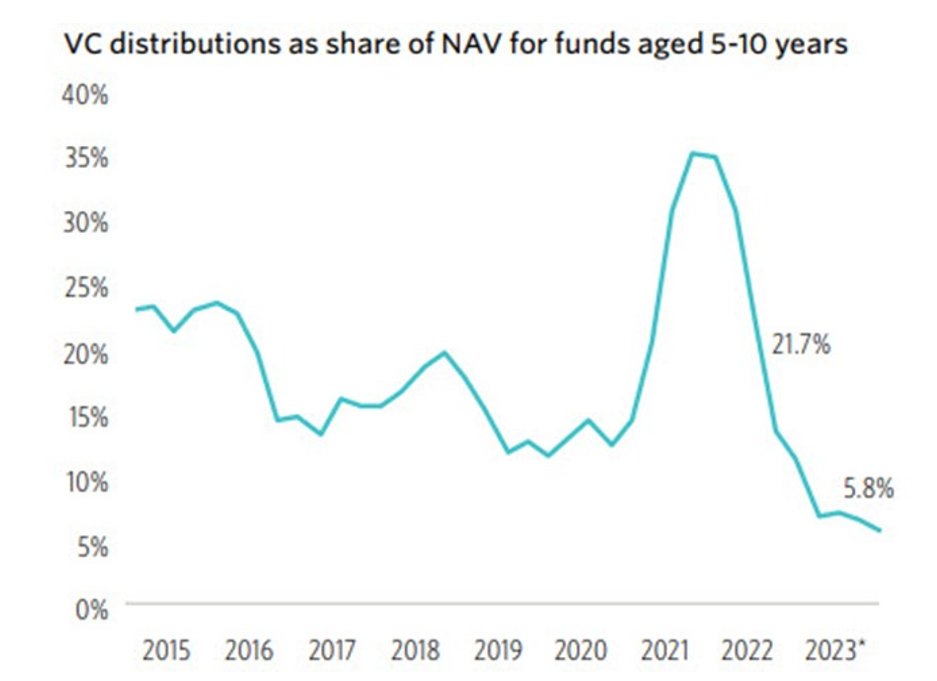
Exit activity directly informs the amount of capital distributions which directly informs performance data. Unrealized gains have been significant but cannot fund new Limited Partner commitments and have been whittled down as the liquidity drought has been extended and some highflyers have gone on to raise additional capital at lower valuations. A Pitchbook analysis (below) underscores the decrease in distributions, which were 5.8% of Net Asset Value in 3Q23. While there is a delay in reported investment returns data, quarter-over-quarter venture capital IRR data are trending upward, coming off a very challenging 2022. The one-year IRR hit a low point in 4Q22 at -17.9% and has “recovered” to -9.1% in 2Q23, according to Pitchbook. A preliminary returns analysis from Cambridge Associates registered a 0.7% pooled return net to Limited Partners for 1Q24.
Globally, across all private capital asset classes investment managers raised $1.17 trillion in 2023 which was nearly 20% less than in 2022, with venture capital declining by over 47%. In the U.S., 100 venture funds raised $9.3 billion in 1Q24, of which $1.6 billion was raised by 28 first-time fund managers. As a point of comparison, $183.5 billion was raised by 1,577 funds in 2021. Ironically, it is estimated that there is $312 billion of “dry powder” held by venture capital funds now. In 1Q24, a total of $155.7 billion of private capital was raised, suggesting continued sluggishness, although a bright spot has been the success of secondary funds, which might hint at additional future liquidity.

Source: NVCA/Pitchbook
Notwithstanding how (relatively) upbeat Chief Financial Officers might be now – 34% claimed to be “very optimistic” which is an eleven quarter high in Grant Thornton’s 1Q24 CFO survey– there has been a spike in bankruptcy filings for companies with public equity and/or debt. In 1Q24 there were 142 such filings, up from 132 in the prior quarter. Directionally, this development highlights both the higher cost of capital and perhaps deteriorating fundamentals, suggesting that investors may be less forgiving over the balance of 2024.
The healthcare technology sector has seen similar trends as was experienced in the broader venture capital market and continues to navigate the duality of the pandemic and rising interest rates. Payors, providers, and pharma – the customers for many healthcare technology companies – are under extraordinary budget pressures. Notably, though, a recent Leerink Partners survey of hospital administrators underscores both the resilience and endurance of these budgets. Automation and AI advances have kept IT priorities centered on clinical and administrative back-office initiatives. While telehealth and other patient-facing solutions have dropped materially on the priority list, overall projected IT budgets increased 14.3% for the rest of 2024.
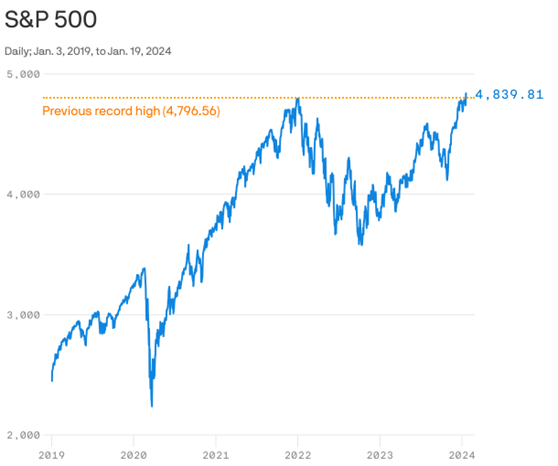
A valuation analysis by Carta (below) for healthcare technology companies shows the relative strength of the Seed and Series A financings but also the dramatic reset of Series D valuations (median pre-money valuations dropped from $940 million in 2021 to $94 million in 2023), in part due to the very poor performance of the public companies in this sector. For instance, while the S&P 500 Index increased 10.2% in 1Q24, the Leerink Digital Health Index declined -6.6% (although the S&P 500 Health Care Index was up 8.4%). Even more pointed, the “High Growth Provider” sub-sector collapsed by -29.9% in 1Q24.

Source: Carta
Setting aside the dramatic impact on healthcare and the $38 trillion estimated costs incurred between now and 2049 by climate change, according to a study by the Potsdam Institute for Climate Impact Research, policy decisions made by our dysfunctional political system risks negating much of the benefits developed by today’s healthcare technology entrepreneurs. Case in point are the concerns now raised by the disenrollment of 20 million people from the Medicaid program, five million of whom were children and 23% of whom are now believed to still be uninsured, hinting at meaningful future health issues.
The U.S. population increased by 7.4% between 2010 – 2020, but the growth was quite uneven by state. While it was the slowest decade of overall growth in the last 100 years, there was significant migration across state lines with states arguably more hostile to innovative healthcare policies experiencing the greatest decline in population. Nearly half of all taxes are collected at the local and state levels which introduces the prospect of a downward spiral as tax bases are undercut, further limiting the ability to provide competent healthcare services.