
What a relief to hear last week that Elon thinks that the new AI models will be superior to human intelligence by the end of next year as many of us are struggling to make sense of the current economic climate. Last week there was a blow-out monthly jobs report, with the non-farm payroll advancing by 303k, almost doubling many analyst forecasts, but then inflation ran hotter than expected at 3.5% in March while the Volatility Index (VIX) spiked 16% this year. GDP growth in 4Q23 was revised upward to 3.4% from 3.2%, and yet the S&P 500 Index was off 1.7% this past week.
Technology disrupts. One observation of disruption is initially it is triggered by a few companies which then enjoy the much of the spoils of those advances. Since the start of the Industrial Age, the waves of disruption have become shorter but more intense, with the impacts being greater and more severe. An analysis by Bank of America concluded that since 1926, just 3% of all companies generated $55 trillion of shareholder value. The analysis also determined that the average lifespan of S&P 500 companies dropped from 61 to 16 years between 1958 and 2021: creative destruction. Nearly one-third of S&P 500 companies have been replaced in the index since 2015 alone. By 2027, it is estimated that average company longevity could be as short as 12 years.
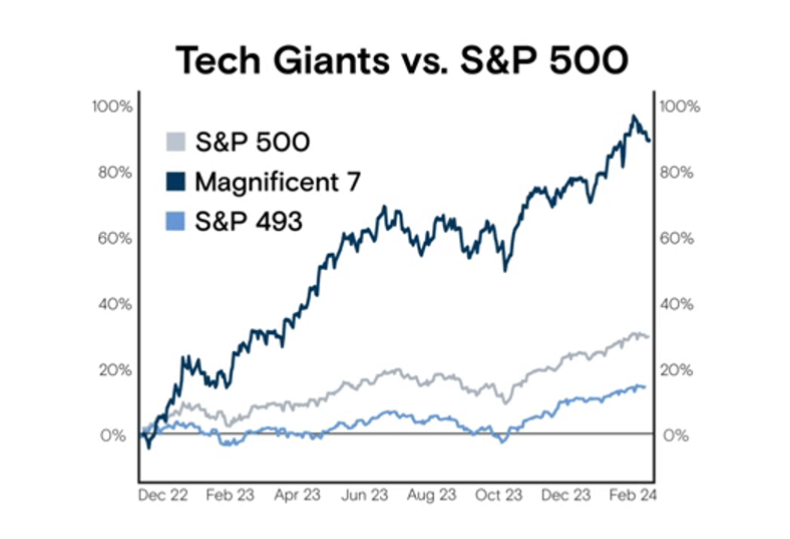
Disruption also raises a concern of power and wealth concentration. Setting aside that the top 1% of Americans now own more than half of all stocks worth $44 trillion or that the UBS Global Wealth Report tallies 59.4 million millionaires globally (only 0.6% of the world’s population), the “Magnificent 7” stocks (Alphabet, Amazon, Apple, Meta, Microsoft, Nvidia, Telsa) have increased by 90% since the beginning of 2023, while the less magnificent 493 have only gained 18%.
Source: Goldman Sachs Research
The issue of concentration in the U.S. public equity markets has not been this acute for nearly 100 years. Today, the top 10 largest U.S. stocks account for 33% of the S&P 500’s market capitalization which eclipses the 27% at the height of the Dot.com bubble 25 years ago, according to research from Goldman Sachs. Fortunately, this concentration has driven a 16% annual return for the S&P 500 Index over the last five years, as compared to 10% over the past 30 years when valuations were more broad-based. Notwithstanding that, the S&P 500 Index enjoyed its best 1Q since 2019, increasing 10%, driving $74 billion of new equity issuances, which was 110% ahead of 1Q23 volume.

Source: Goldman Sachs Research
The valuation bubble over two decades ago is relevant again given the current raging AI bull market. An analysis by Apollo Global highlights how elevated the forward median P/E multiple is for the Top 10 stocks in the S&P 500 Index, which is now touching 40x, versus the 20.9x for the overall index (which is closer to where the Top 10 stocks were trading in 2000). Notably, Warren Buffett’s Berkshire Hathaway has been sitting on $168 billion of cash for some time and has been reluctant to invest at these levels. The ratio of corporate insider selling to buying hit its highest level this quarter since 1Q21, according to Verity LLC, driven mostly by technology executives.

Source: Apollo Global
Of course, the P/E multiple is a function of underlying earnings (both quality and momentum) so arguably investors have concluded – at least for the time being – that these market-leading companies possess both. From just prior to the pandemic to 2Q22, corporate profit margins increased markedly from nearly 13% to 17% and have only slipped to 16.4% by 3Q23 with the resolution of supply and labor constraints, according to an analysis by the Commerce Department. One question raised by these data is whether strong corporate profits drive inflation. The Wall Street Journal observed that from late 2019 to late 2023, corporate profits increased by 40% while labor and other supply costs increased by only 17%. Had profits simply grown at the same rate as labor and supply costs, prices may have only increased by 12.5%, leading to an annual inflation rate this year that most likely would have been 100 basis points lower.

Source: Commerce Department
Interestingly, with the euphoria of AI, the crypto asset class is enjoying a mini renaissance of sorts. Capital flows into crypto funds have spiked in an unprecedented manner, suggesting that cumulative investments this year into these funds could total $54 billion. Over the last twelve months, the price of Bitcoin has increased 133% and more than 54% year-to-date. The strongest performing asset this quarter was Cocoa, also up 133%, given the climate crisis in western Africa. Sadly, and surprisingly, the worst performing asset was the NYMEX Natural Gas Index which was down 30% in 1Q24.

Source: EPFR
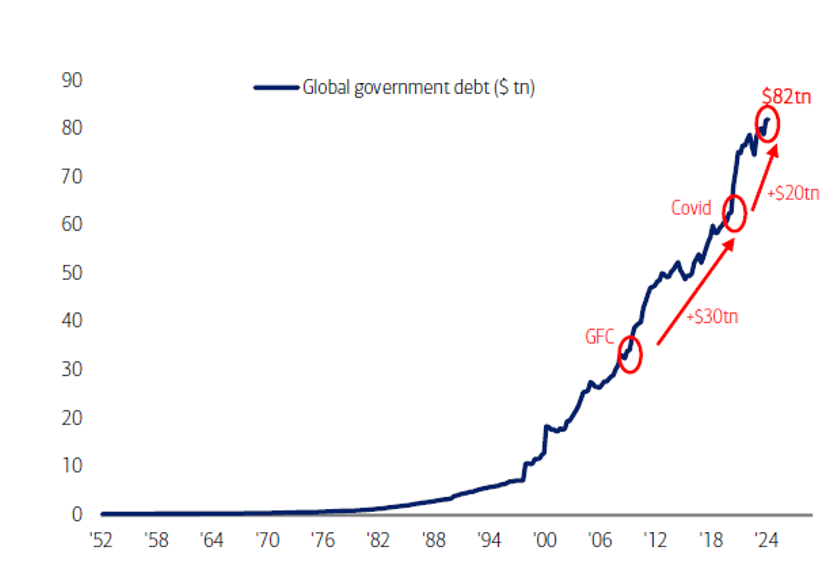
Another troubling sign hiding in plain sight is global debt levels, both corporate and government debt. Arguably, the availability of debt capital has contributed to the explosion of asset values generally which has led some to be concerned about systemic risk. Notwithstanding that the Federal Reserve’s recent Summary of Economic Projections has increased its 2024 U.S. GDP growth estimates from 1.4% to 2.1% just over the last 90 days, the U.S. national debt will reach $35 trillion by May 2024 and will double over the next eight years. Every 100 days the national debt increases by $1 trillion. Government spending in 2024 is expected to hit $6.7 trillion; $1.1 trillion in interest payments have been made just in the past twelve months.
Source: Bloomberg, Haver
The Congressional Budget Office (CBO) now estimates that in 30 years – in 2054 – interest payments will equal 6.3% of GDP, while social safety net programs (Social Security, Medicare, etc) will consume more than half of the federal budget. The CBO forecasts that debt as a percent of GDP will be 107% by 2029 and a staggering 166% by 2054.
Just over a year ago the private capital markets were deeply rattled by the failures of Silicon Valley Bank, Signature Bank, and First Republic Bank. Remarkably, the investment community (relatively) quickly adjusted, casting a bright light on the importance – and scale – of the private credit market. As of mid-2023, the Federal Reserve estimated that this market was $1.7 trillion and that there was approximately $800 billion of private direct lending. This illiquid non-bank lending market is rather opaque, which has made some nervous about the systemic risk that may be lurking – especially in an environment with elevated interest rates and a spike in credit defaults.

Source: Preqin
Somewhat encouraging has been the level of refinancing activity over the past few quarters which has reduced the amount of high yield debt due between 2024 – 2026 by 40% to $329 billion, according to an analysis by Bank of America. Anxiety was building in 2023 about the wall many companies were going to run into were it not for the recent robustness of the private credit market. This past quarter saw $325 billion of private debt financing, which was near an all-time high and likely due to relatively high interest rates and strong corporate performance (and perhaps, in part, due to borrowers’ desperation). Something to be watched closely: the Federal Reserve’s Shared National Credit Program, which monitors performance of these loans, estimates that 26% of them are at risk of being “non-performing.” That amount now totals nearly $490 billion; it was $348 billion at the end of 2022.

Source: Pitchbook, Axios
Further complicating the analysis has been the disappearance of the “equity risk premium” which effectively evaporated in early 2024. This metric, which measures the excess return from public stocks over a risk-free rate (i.e., Treasuries), underscores both the lofty equity valuations today but also the rapid rise in interest rates and the relative attractiveness of holding senior securities with covenants.

Source: Oaktree Capital Management, Axios
One other possible harbinger as to the quality of debt portfolios: the burden of credit card debt on consumers. Interest and fee payments increased 50% in 2023 from 2020 to $157 billion, according to Federal Deposit Insurance Corp (FDIC) data. At the end of 2023, it was estimated that there was $1.13 trillion of credit card debt and that the delinquency rate was 4%, which is thankfully well below the 7.1% seen during the Great Recession 15 years ago but is rising. Not helping matters is the staggering $1.6 trillion of student loan debt held by 43.2 million Americans as of 4Q23, leading the Biden Administration to authorize the forgiveness of approximately $150 billion of that debt burden.
There are also loud whispers about the credit risks residing in the commercial real estate sector, for which banks hold approximately 50% of all loans. The FDIC estimated that there were $478 billion in unrealized losses on securities in the banking system at the end of 2023, which is roughly 20% of the capital in the system.
Arguably, one of the greatest global systemic risks resides in China, which has been the provider of cheap capital to the global financial system for years and is now under severe strain. The country recently tiptoed over the 300% of Debt to GDP threshold, exposing the monumental real estate debt issues, to say nothing of slowing economic growth rates, structural under-employment, and a rapidly aging population. Last week Fitch Ratings lowered its outlook on China’s long-term credit rating to “negative.” A recent Swiss Re report estimates that there is $8.9 trillion of Chinese real estate loans. Exports dropped 7.5% year-over-year in March. A hard landing in China will be felt around the world, ironically likely leading to lower inflation rates in the U.S. with a flood of cheap(er) Chinese imports. See Janet Yellin’s recent trip to China.

Source: CEIC, Bank for International Settlements
Obviously, we live in a global marketplace, as much as some national leaders try to undermine that reality. Advances in technology both drive employee productivity, improve standards of living, but also attract capital at reasonable costs. China has enjoyed exceptional productivity growth, estimated to be approximately 8% per annum over 25 years (1997 – 2022), according to an analysis conducted by McKinsey & Company, but at quite modest economic values per employee. Relative to other “Advanced” economies, the U.S. has enjoyed slightly greater productivity growth (~1.5% vs 1.0%) over those same 25 years with more than $110k values per employee. The challenge now is to harness this next wave of innovation in AI to further drive productivity per employee, and in so doing, to increase the economic value created per employee.

Source: McKinsey & Company
Access to cheap capital has financed much of this innovation that has powered the U.S. economy. Excessive leverage and highly concentrated power and wealth are troublesome given these uncertain times, making the path forward all the more confusing.
To come full circle. According to the International Energy Agency, one ChatGPT request requires 2.9 watt-hours of electricity which is enough to power a 60-watt light bulb for about three minutes and is 10x the power required for one Google search. The power required to support the growth of the AI industry from 2023 to 2026, when AI will be smarter than all of us, will increase 10x. Industry analysts estimate that AI data centers by 2030 will consume 20% – 25% of all power generated in the U.S., up from ~4% today. The computing power needed to train one Large Language Model is increasing 275x every two years. The AI boom contributed directly to a 27k metric ton deficit of refined copper last year, according to International Copper Study Group. All of this seems like a monumental obstacle.
It may well turn out that we will not be able to rely on AI to figure all this out for us after all…
