On the heels of the NFL draft, Flare Capital is excited to announce two new first round draft choices as we continue to expand our team. Recognizing how competitive our league is, we look to build a roster of All Stars from top to bottom. With a nod to the recent FTC non-compete ruling, we also welcome all unrestricted free agents who are excited to put on the Flare Capital uniform every day.
As we are now on the clock, the envelopes please. Presented alphabetically, please welcome our two newest team members…
Amanda DiTrolio was drafted to be our Director of Marketing and Platform. Prior to joining the firm, Amanda was the Growth and Operations Lead at Health Tech Nerds, a dedicated and passionate community of over 5k healthcare technology innovators who are obsessively focused on transforming the business of healthcare. Partnered with our good friend Kevin O’Leary, Amanda managed events, penned thought pieces, and delivered every Sunday to over 22k of us a healthcare newsletter that is required reading. Prior to HTN, Amanda spent several years at CB Insights as its Healthcare Intelligence Analyst. While at New York University – Polytechnic School of Engineering, where she earned a B.S. in Chemical and Biomolecular Engineering, she interned with a few venture capital and social impact firms, demonstrating very early on her commitment to our sector.
As our Director of Marketing and Platform, Amanda will continue to push the firm forward on thought leadership and to build even more engaged communities around the firm. Whether it is our very successful quarterly Expert Roundtable Series(next one is June 25 @ noon ET), important thought pieces and blog posts, or more entertaining pickleball and ping pong tournaments, the best entrepreneurs have many alternatives to raise capital and we want to be the firm that helps them look around corners. Additionally, Amanda will continue to evolve our Flare Scholar program that now has nearly 400 current and former members. This has become a cornerstone asset of the firm.
We are also thrilled to welcome Jessica Radford as our Director of Investor Relations. Prior to joining Flare Capital, Jessica worked with some very innovative companies across a range of industries from strategic consulting to crypto exchanges to e-commerce platforms. With an emphasis on human capital management, what most impressed us about this draft choice was her ability to organize key stakeholders and articulate a strategy and approach that resonated with all involved. Magnetic and articulate, Jessica will deepen our engagement with our current investors and light up new relationships as we continue to scale the Flare Capital franchise. While earning her B.A. from Purdue University in Organizational Communication and Management, she also spent time in Australia studying international business.
As with our portfolio companies, raising capital and collaborating with our investors simply need to be core competencies. The strength of our firm is predicated on having long-term sophisticated investment partners, which we are deeply fortunate to have. A portion of the capital we manage is provided by nearly three dozen strategic LPs, who collectively touch nearly 25% of all healthcare spend annually. We listen carefully to the strategic issues they are solving as that often informs where we might look to invest. Jessica will play an important role in deepening these conversations and making them even more actionable. Our financial investors (endowments, foundations, sovereign wealth funds, family offices) also are a critical set of partners as they look for exciting co-investment opportunities.
As with our entrepreneurs, our investors have a near-infinite set of investment alternatives. To stand out and earn their trust, we need to do hundreds of little things (mostly) right every day. We compete on the strength of our investment team and the value we can help drive for our entrepreneurs and investors. Ultimately, it is still all about compelling investment returns. The great fortune we enjoy investing in early-stage healthcare technology companies is that as our companies transform the business of healthcare, significant returns will be generated. These two team additions will help make that more of a reality.
Unfortunately, though, this is not a sport where everyone gets a trophy. Only the best teams win.
Welcome aboard, Amanda and Jessica…grab your helmets…
Consider this: over the past five years nearly $78 billion has been invested in digital health companies and yet just this past year over 20 million Americans were taken off the Medicaid rolls. Certain policy changes can be very damaging, to say nothing of other human-induced factors like pollution, climate change, wars, inadequate housing and education, and hunger which have staggering implications on health. At times it can feel like bailing water out of a sinking ship. These issues can negate years of innovation (and investment), exacerbating the profound issues of cost and access. Is it all worth it? Arguably, yes, as technology is the great democratizing force in healthcare and should create a rising tide.
The opportunities to “transform the business of healthcare” (Flare Capital’s tag line) remain obvious and acute, notwithstanding that the level of investment activity has receded from the $30 billion highwater mark in 2021 to a more manageable $10 – $12 billion annual pace. Healthcare technology now represents approximately 8% of all venture capital investments. Just as important is the number of companies funded which is trending back to 400 – 500 companies per year, implying that round sizes have decreased dramatically to ~$20 million, according to data from Rock Health.
Source: Rock Health
Arguably, the 2021 hangover still lingers in the healthcare technology sector as companies that raised too much capital at too high a price work to sort out challenging cap tables. Out of the 2021 mosh pit of too many companies, it appears that the sector is in an “Emerging Winners” phase that will drive companies with narrow and/or incomplete offerings to combine or shut down. In general, financing rounds provide 15 – 18 months of runway, implying that maybe a company can raise ~3 years of capital before having to really make the call on its true prospects. This would put us squarely in the 2024 window. Rock Health flagged that 44% of all 2023 financing rounds were “unlabeled,” suggesting a high proportion of insider bridge extensions to buy a few more quarters.
This is not just a healthcare technology phenomenon. The overall venture capital activity in 1Q24 was a relatively muted $36.6 billion across 2,882 companies for an average round size of $12.7 million, as compared to $51.6 billion and 4,026 companies in 1Q23 according to a recent NVCA/Pitchbook analysis. This more defensive posture is expected given the continued and prolonged reduction in exit activity. For 1Q24, exits totaled a modest $18.4 billion across 223 transactions, approximately half of the value of new investments but a mere 8% of total companies funded, suggesting an ecosystem still out of balance. Some additional context: total assets under management by venture capital firms is $1.2 trillion.
Source: NVCA/Pitchbook
While venture investment quarter-over-quarter was modestly down ($40.1 billion in 4Q23 versus $36.6 billion in 1Q24), the number of companies that raised capital declined by 575. Both Early and Late Stage activity were relatively flat, and together accounted for 63% of the number of financings, while the Growth Stage dropped by $4.8 billion. Ironically, even employees wanted to hold less equity in venture-backed companies. According to an analysis of 43k companies by Carta, employees held 37% less equity in those companies as compared to 18 months ago, while salaries were largely unchanged.
A significant contributor to this downdraft was the decline in “mega rounds” (over $100 million). While less than 3% of all financings, “mega rounds” accounted for 47% of the capital deployed with an average round size in 1Q24 of $226 million versus $298 million in 4Q23. Surprisingly, there were 37 newly minted unicorns in 1Q24, which was 48% greater than 4Q23. The level of “first-time financings” materially dropped from $4.0 billion in 1,242 companies in 1Q23 to $3.1 billion in 827 companies in 1Q24, perhaps reflecting greater risk aversion to back first-time founders.
This deceleration is not unique to the U.S. as global venture investment activity declined 30% in 1Q24, according to analysis by Preqin, with China declining by 40%. The total amount invested was $57.8 billion, the lowest quarterly pace since 2017. Were it not for the AI frenzy, these numbers would likely be lower still.
As capital became more expensive and harder to access over the last three years, median round sizes declined meaningfully across all stages but with the greatest 1Q24 decline for Growth Stage companies, now only registering an unbelievable $5.7 million. While the trends are similar, the average Growth Stage round size in 1Q24 was much greater at $31.8 million, reflecting the impact of the “mega rounds.”
Source: NVCA/Pitchbook
Arguably, the more interesting analysis is the impact on median pre-money valuations by stage. After a precipitous drop from 2021 to 2023 for Growth Stage financings ($400 million to $144 million), there are signs of life in 1Q24, notwithstanding the reduced level of overall investment activity. Across all stages there has been a sharp increase in median pre-money valuations, with the Growth Stage coming in at $229 million, which almost looks to be a typo. Notwithstanding that, Carta estimated that 20% of all financings in 2023 were “down rounds.”
Source: NVCA/Pitchbook
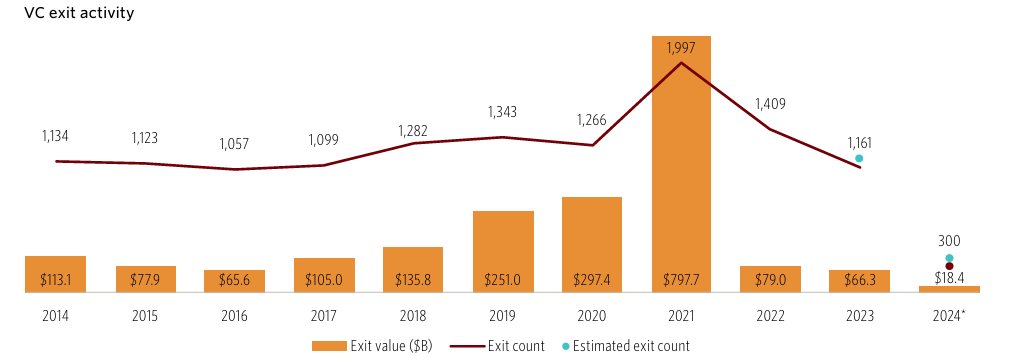
Liquidity makes the venture capital world go round. Sadly, that part of the narrative has stalled with an estimated 300 exit transactions totaling $18.4 billion (average deal size of $61 million), which is tricky when compared to the pre-money valuations. Pitchbook now estimates that there are 55k venture-backed companies with the average age of Growth Stage companies at 13.1 years; Late Stage companies are on average 9.5 years old. Bain & Co recently reported that there are 28k private equity portfolio companies that are worth $3.2 trillion. In 2023, the value of exited companies by private equity firms declined by 44% from 2022, the lowest level in a decade.
Source: NVCA/Pitchbook
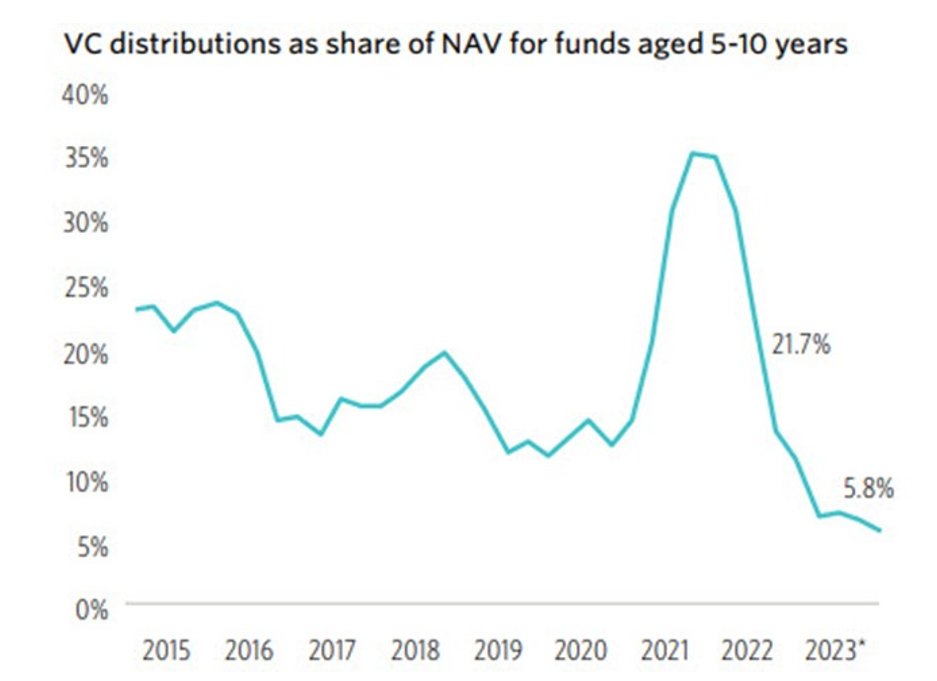
Exit activity directly informs the amount of capital distributions which directly informs performance data. Unrealized gains have been significant but cannot fund new Limited Partner commitments and have been whittled down as the liquidity drought has been extended and some highflyers have gone on to raise additional capital at lower valuations. A Pitchbook analysis (below) underscores the decrease in distributions, which were 5.8% of Net Asset Value in 3Q23. While there is a delay in reported investment returns data, quarter-over-quarter venture capital IRR data are trending upward, coming off a very challenging 2022. The one-year IRR hit a low point in 4Q22 at -17.9% and has “recovered” to -9.1% in 2Q23, according to Pitchbook. A preliminary returns analysis from Cambridge Associates registered a 0.7% pooled return net to Limited Partners for 1Q24.
Globally, across all private capital asset classes investment managers raised $1.17 trillion in 2023 which was nearly 20% less than in 2022, with venture capital declining by over 47%. In the U.S., 100 venture funds raised $9.3 billion in 1Q24, of which $1.6 billion was raised by 28 first-time fund managers. As a point of comparison, $183.5 billion was raised by 1,577 funds in 2021. Ironically, it is estimated that there is $312 billion of “dry powder” held by venture capital funds now. In 1Q24, a total of $155.7 billion of private capital was raised, suggesting continued sluggishness, although a bright spot has been the success of secondary funds, which might hint at additional future liquidity.
Source: NVCA/Pitchbook
Notwithstanding how (relatively) upbeat Chief Financial Officers might be now – 34% claimed to be “very optimistic” which is an eleven quarter high in Grant Thornton’s 1Q24 CFO survey– there has been a spike in bankruptcy filings for companies with public equity and/or debt. In 1Q24 there were 142 such filings, up from 132 in the prior quarter. Directionally, this development highlights both the higher cost of capital and perhaps deteriorating fundamentals, suggesting that investors may be less forgiving over the balance of 2024.
The healthcare technology sector has seen similar trends as was experienced in the broader venture capital market and continues to navigate the duality of the pandemic and rising interest rates. Payors, providers, and pharma – the customers for many healthcare technology companies – are under extraordinary budget pressures. Notably, though, a recent Leerink Partners survey of hospital administrators underscores both the resilience and endurance of these budgets. Automation and AI advances have kept IT priorities centered on clinical and administrative back-office initiatives. While telehealth and other patient-facing solutions have dropped materially on the priority list, overall projected IT budgets increased 14.3% for the rest of 2024.
A valuation analysis by Carta (below) for healthcare technology companies shows the relative strength of the Seed and Series A financings but also the dramatic reset of Series D valuations (median pre-money valuations dropped from $940 million in 2021 to $94 million in 2023), in part due to the very poor performance of the public companies in this sector. For instance, while the S&P 500 Index increased 10.2% in 1Q24, the Leerink Digital Health Index declined -6.6% (although the S&P 500 Health Care Index was up 8.4%). Even more pointed, the “High Growth Provider” sub-sector collapsed by -29.9% in 1Q24.
Source: Carta
Setting aside the dramatic impact on healthcare and the $38 trillion estimated costs incurred between now and 2049 by climate change, according to a study by the Potsdam Institute for Climate Impact Research, policy decisions made by our dysfunctional political system risks negating much of the benefits developed by today’s healthcare technology entrepreneurs. Case in point are the concerns now raised by the disenrollment of 20 million people from the Medicaid program, five million of whom were children and 23% of whom are now believed to still be uninsured, hinting at meaningful future health issues.
The U.S. population increased by 7.4% between 2010 – 2020, but the growth was quite uneven by state. While it was the slowest decade of overall growth in the last 100 years, there was significant migration across state lines with states arguably more hostile to innovative healthcare policies experiencing the greatest decline in population. Nearly half of all taxes are collected at the local and state levels which introduces the prospect of a downward spiral as tax bases are undercut, further limiting the ability to provide competent healthcare services.
What a relief to hear last week that Elon thinks that the new AI models will be superior to human intelligence by the end of next year as many of us are struggling to make sense of the current economic climate. Last week there was a blow-out monthly jobs report, with the non-farm payroll advancing by 303k, almost doubling many analyst forecasts, but then inflation ran hotter than expected at 3.5% in March while the Volatility Index (VIX) spiked 16% this year. GDP growth in 4Q23 was revised upward to 3.4% from 3.2%, and yet the S&P 500 Index was off 1.7% this past week.
Technology disrupts. One observation of disruption is initially it is triggered by a few companies which then enjoy the much of the spoils of those advances. Since the start of the Industrial Age, the waves of disruption have become shorter but more intense, with the impacts being greater and more severe. An analysis by Bank of America concluded that since 1926, just 3% of all companies generated $55 trillion of shareholder value. The analysis also determined that the average lifespan of S&P 500 companies dropped from 61 to 16 years between 1958 and 2021: creative destruction. Nearly one-third of S&P 500 companies have been replaced in the index since 2015 alone. By 2027, it is estimated that average company longevity could be as short as 12 years.
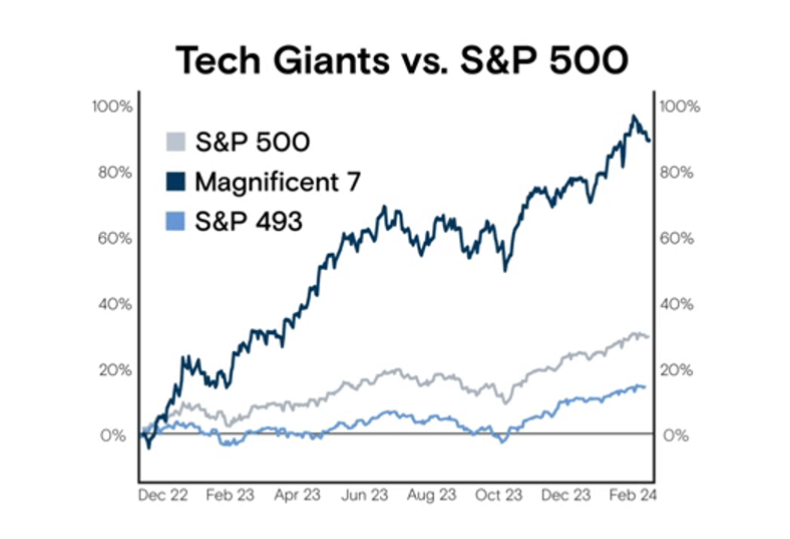
Disruption also raises a concern of power and wealth concentration. Setting aside that the top 1% of Americans now own more than half of all stocks worth $44 trillion or that the UBS Global Wealth Report tallies 59.4 million millionaires globally (only 0.6% of the world’s population), the “Magnificent 7” stocks (Alphabet, Amazon, Apple, Meta, Microsoft, Nvidia, Telsa) have increased by 90% since the beginning of 2023, while the less magnificent 493 have only gained 18%.
Source: Goldman Sachs Research
The issue of concentration in the U.S. public equity markets has not been this acute for nearly 100 years. Today, the top 10 largest U.S. stocks account for 33% of the S&P 500’s market capitalization which eclipses the 27% at the height of the Dot.com bubble 25 years ago, according to research from Goldman Sachs. Fortunately, this concentration has driven a 16% annual return for the S&P 500 Index over the last five years, as compared to 10% over the past 30 years when valuations were more broad-based. Notwithstanding that, the S&P 500 Index enjoyed its best 1Q since 2019, increasing 10%, driving $74 billion of new equity issuances, which was 110% ahead of 1Q23 volume.
Source: Goldman Sachs Research
The valuation bubble over two decades ago is relevant again given the current raging AI bull market. An analysis by Apollo Global highlights how elevated the forward median P/E multiple is for the Top 10 stocks in the S&P 500 Index, which is now touching 40x, versus the 20.9x for the overall index (which is closer to where the Top 10 stocks were trading in 2000). Notably, Warren Buffett’s Berkshire Hathaway has been sitting on $168 billion of cash for some time and has been reluctant to invest at these levels. The ratio of corporate insider selling to buying hit its highest level this quarter since 1Q21, according to Verity LLC, driven mostly by technology executives.
Source: Apollo Global
Of course, the P/E multiple is a function of underlying earnings (both quality and momentum) so arguably investors have concluded – at least for the time being – that these market-leading companies possess both. From just prior to the pandemic to 2Q22, corporate profit margins increased markedly from nearly 13% to 17% and have only slipped to 16.4% by 3Q23 with the resolution of supply and labor constraints, according to an analysis by the Commerce Department. One question raised by these data is whether strong corporate profits drive inflation. The Wall Street Journal observed that from late 2019 to late 2023, corporate profits increased by 40% while labor and other supply costs increased by only 17%. Had profits simply grown at the same rate as labor and supply costs, prices may have only increased by 12.5%, leading to an annual inflation rate this year that most likely would have been 100 basis points lower.
Source: Commerce Department
Interestingly, with the euphoria of AI, the crypto asset class is enjoying a mini renaissance of sorts. Capital flows into crypto funds have spiked in an unprecedented manner, suggesting that cumulative investments this year into these funds could total $54 billion. Over the last twelve months, the price of Bitcoin has increased 133% and more than 54% year-to-date. The strongest performing asset this quarter was Cocoa, also up 133%, given the climate crisis in western Africa. Sadly, and surprisingly, the worst performing asset was the NYMEX Natural Gas Index which was down 30% in 1Q24.
Source: EPFR
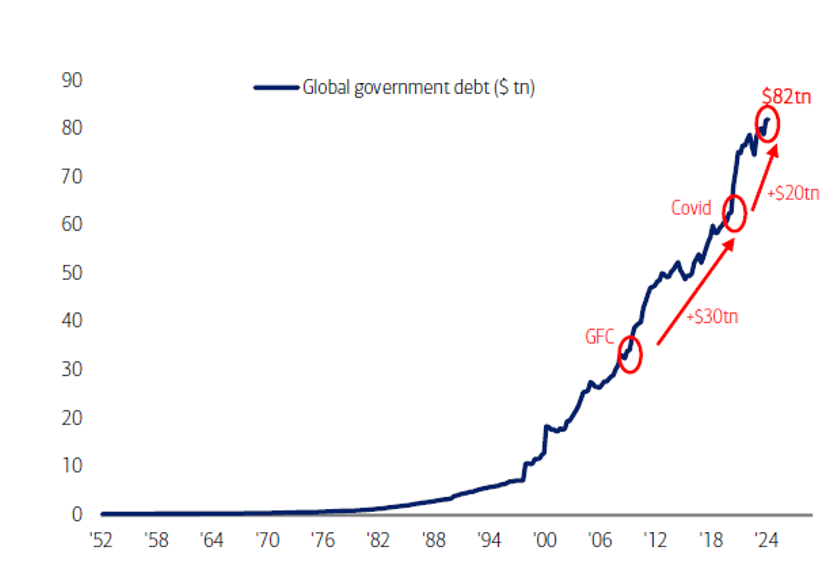
Another troubling sign hiding in plain sight is global debt levels, both corporate and government debt. Arguably, the availability of debt capital has contributed to the explosion of asset values generally which has led some to be concerned about systemic risk. Notwithstanding that the Federal Reserve’s recent Summary of Economic Projections has increased its 2024 U.S. GDP growth estimates from 1.4% to 2.1% just over the last 90 days, the U.S. national debt will reach $35 trillion by May 2024 and will double over the next eight years. Every 100 days the national debt increases by $1 trillion. Government spending in 2024 is expected to hit $6.7 trillion; $1.1 trillion in interest payments have been made just in the past twelve months.
Source: Bloomberg, Haver
The Congressional Budget Office (CBO) now estimates that in 30 years – in 2054 – interest payments will equal 6.3% of GDP, while social safety net programs (Social Security, Medicare, etc) will consume more than half of the federal budget. The CBO forecasts that debt as a percent of GDP will be 107% by 2029 and a staggering 166% by 2054.
Just over a year ago the private capital markets were deeply rattled by the failures of Silicon Valley Bank, Signature Bank, and First Republic Bank. Remarkably, the investment community (relatively) quickly adjusted, casting a bright light on the importance – and scale – of the private credit market. As of mid-2023, the Federal Reserve estimated that this market was $1.7 trillion and that there was approximately $800 billion of private direct lending. This illiquid non-bank lending market is rather opaque, which has made some nervous about the systemic risk that may be lurking – especially in an environment with elevated interest rates and a spike in credit defaults.
Source: Preqin
Somewhat encouraging has been the level of refinancing activity over the past few quarters which has reduced the amount of high yield debt due between 2024 – 2026 by 40% to $329 billion, according to an analysis by Bank of America. Anxiety was building in 2023 about the wall many companies were going to run into were it not for the recent robustness of the private credit market. This past quarter saw $325 billion of private debt financing, which was near an all-time high and likely due to relatively high interest rates and strong corporate performance (and perhaps, in part, due to borrowers’ desperation). Something to be watched closely: the Federal Reserve’s Shared National Credit Program, which monitors performance of these loans, estimates that 26% of them are at risk of being “non-performing.” That amount now totals nearly $490 billion; it was $348 billion at the end of 2022.
Source: Pitchbook, Axios
Further complicating the analysis has been the disappearance of the “equity risk premium” which effectively evaporated in early 2024. This metric, which measures the excess return from public stocks over a risk-free rate (i.e., Treasuries), underscores both the lofty equity valuations today but also the rapid rise in interest rates and the relative attractiveness of holding senior securities with covenants.
Source: Oaktree Capital Management, Axios
One other possible harbinger as to the quality of debt portfolios: the burden of credit card debt on consumers. Interest and fee payments increased 50% in 2023 from 2020 to $157 billion, according to Federal Deposit Insurance Corp (FDIC) data. At the end of 2023, it was estimated that there was $1.13 trillion of credit card debt and that the delinquency rate was 4%, which is thankfully well below the 7.1% seen during the Great Recession 15 years ago but is rising. Not helping matters is the staggering $1.6 trillion of student loan debt held by 43.2 million Americans as of 4Q23, leading the Biden Administration to authorize the forgiveness of approximately $150 billion of that debt burden.
There are also loud whispers about the credit risks residing in the commercial real estate sector, for which banks hold approximately 50% of all loans. The FDIC estimated that there were $478 billion in unrealized losses on securities in the banking system at the end of 2023, which is roughly 20% of the capital in the system.
Arguably, one of the greatest global systemic risks resides in China, which has been the provider of cheap capital to the global financial system for years and is now under severe strain. The country recently tiptoed over the 300% of Debt to GDP threshold, exposing the monumental real estate debt issues, to say nothing of slowing economic growth rates, structural under-employment, and a rapidly aging population. Last week Fitch Ratings lowered its outlook on China’s long-term credit rating to “negative.” A recent Swiss Re report estimates that there is $8.9 trillion of Chinese real estate loans. Exports dropped 7.5% year-over-year in March. A hard landing in China will be felt around the world, ironically likely leading to lower inflation rates in the U.S. with a flood of cheap(er) Chinese imports. See Janet Yellin’s recent trip to China.
Source: CEIC, Bank for International Settlements
Obviously, we live in a global marketplace, as much as some national leaders try to undermine that reality. Advances in technology both drive employee productivity, improve standards of living, but also attract capital at reasonable costs. China has enjoyed exceptional productivity growth, estimated to be approximately 8% per annum over 25 years (1997 – 2022), according to an analysis conducted by McKinsey & Company, but at quite modest economic values per employee. Relative to other “Advanced” economies, the U.S. has enjoyed slightly greater productivity growth (~1.5% vs 1.0%) over those same 25 years with more than $110k values per employee. The challenge now is to harness this next wave of innovation in AI to further drive productivity per employee, and in so doing, to increase the economic value created per employee.
Source: McKinsey & Company
Access to cheap capital has financed much of this innovation that has powered the U.S. economy. Excessive leverage and highly concentrated power and wealth are troublesome given these uncertain times, making the path forward all the more confusing.
To come full circle. According to the International Energy Agency, one ChatGPT request requires 2.9 watt-hours of electricity which is enough to power a 60-watt light bulb for about three minutes and is 10x the power required for one Google search. The power required to support the growth of the AI industry from 2023 to 2026, when AI will be smarter than all of us, will increase 10x. Industry analysts estimate that AI data centers by 2030 will consume 20% – 25% of all power generated in the U.S., up from ~4% today. The computing power needed to train one Large Language Model is increasing 275x every two years. The AI boom contributed directly to a 27k metric ton deficit of refined copper last year, according to International Copper Study Group. All of this seems like a monumental obstacle.
It may well turn out that we will not be able to rely on AI to figure all this out for us after all…