
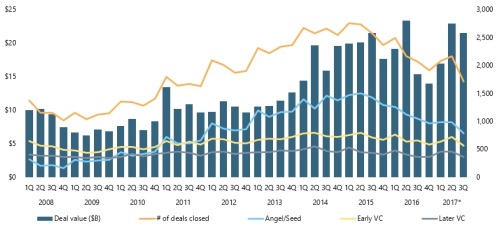
With Bitcoin blasting through the $7,800 per token ceiling last week (then promptly dropping $1,000 in last two days), Apple now worth $900 billion, and unemployment at 4.1%, it is a good time to look at 3Q17 funding data. The venture capital industry continued to power along in 3Q 2017 as 1,706 companies raised $21.5 billion. While a slight decrease from the activity in 2Q 2017, the annualized pace suggests that 2017 will be one of the most active years on record for capital deployed. Notwithstanding the evidence that mutual funds and hedge funds have pulled back somewhat from their investment pace in 2014-2016, sovereign wealth funds and SoftBank’s recently upsized to $98 billion Vision Fund (closed in May 2017) have continued to drive overall investment activity.
In fact, the SoftBank impact is more dramatic than one might initially have thought. The largest investment in the quarter was the Vision Fund’s $3 billion investment in WeWork, which means that 14% of the capital invested in 3Q17 went to 0.06% of the companies. Year-to-date there were 61 venture financing rounds that were greater than $100 million; in 3Q17 alone, there was $8 billion invested in $100+ million rounds and SoftBank was 52% of that amount. In its first six months, the Vision Fund has invested $18.4 billion in 15 companies already, which is just over 40% of total venture capital invested in last two quarters.
The number of large financings somewhat masks the fact that the overall number of investments is declining markedly. In fact, this past quarter was the lowest deal total in the past 24 quarters extending all the way back to 4Q11. The most dramatic retrenchment occurred in the Angel/Seed and Early Stage rounds, which likely correlates to elevated pre-money valuations, which at $15.9 million for Series A deals year-to-date is over twice the valuation levels from 2008 -2013. Late Stage valuations over that same period were between $50 – $100 million, and through 2017, the average Late Stage valuation was pegged at $250 million.
Most of the buzz this past quarter involved cryptocurrencies and the explosion of Initial Coin Offerings (covered here). Notwithstanding the very legitimate concerns by regulators and the IRS, there were 140 ICOs that raised in aggregate $2.2 billion in 3Q17 according to CoinSchedule. In most cases, these companies do not have an existing product, provide little to no substantive due diligence materials, and the issued tokens trade with extreme volatility. Whether these tokens go on to be an enduring source of financing is not clear, but in the moment, this is a very tempting (and fast and inexpensive) way for entrepreneurs to finance interesting projects with no pesky shareholders. One other emerging issue: according to Motherboard, a single Bitcoin transaction requires 215 kilowatt-hours of electricity which is enough to power the average U.S. home for one week. As a point of comparison, venture capitalists have invested $23.2 billion in 2,272 Software companies year-to-date, highlighting how material ICOs have become.
There was considerable discussion on the state of the exit market and the level of liquidity. With the prevalence of very large Late Stage financings, many high-quality companies are choosing to stay private longer. According to PitchBook, there have been only 530 venture-backed exits year-to-date with aggregate exit value of $36.4 billion ($69 million per exit on average, which likely is below invested capital in many cases). More troubling has been the lack of any meaningful IPO activity. While overall there were 29 IPOs which raised $4.1 billion, only 8 of them were venture-backed. Importantly this was a decrease of 30% from the IPO level in 3Q 2016 and was driven by the 70% decline in technology IPOs. In stark contrast, per Dealogic data, IPOs in China raised $8.6 billion year-to-date.
Exits come in many shapes and sizes. Companies that shut-down are one of the (many) hazards of the job (it is not unusual for great performing venture funds to write-off 25+% of invested capital in any given fund). Per TechCrunch, through the first three quarters of 2017, the top ten venture-backed companies that failed had raised in aggregate $1.7 billion and included some very recognizable names such as Jawbone, Beepi, Yik Yak and Juicero. Ironically, in 3Q17, $1.7 billion was invested in 788 Angel/Seed stage companies.
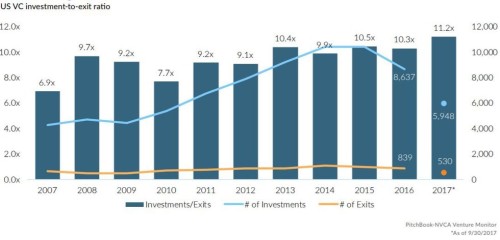
An interesting lens through which to assess the state of the exit environment is how many companies are funded each year as compared to how many are exited. The chart below shows that ratio to be at a highwater mark of over 11x, underscoring that companies are staying private much longer. Interestingly, it is estimated that the cumulative value of all unicorns today is approximately $575 billion which reflects significant unrealized value for many venture funds.
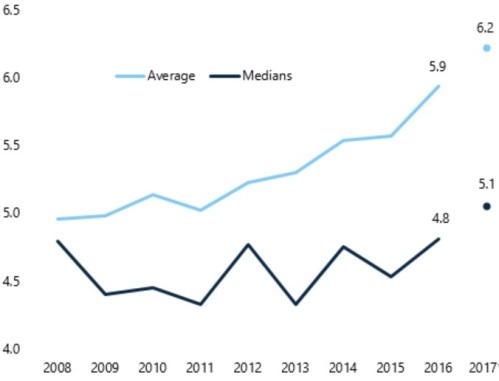
The time to exit is very important as well and something that is tracked closely. While venture firms tend to be more focused on multiple of invested capital to determine whether a given investment was successful, many fund investors think in terms of IRRs – and time is not your friend in that discussion. Over long durations, the venture capital asset class consistently generates the most attractive net returns to investors, but according to Cambridge Associates, short-term venture capital returns recently have lagged other asset classes. For instance, 2Q17 IRRs for venture capital, private equity and the S&P 500 index were 2.0%, 5.1% and 3.1%, respectively. Year-to-date and the one-year performance for venture, private equity and S&P 500 are 5.3%/9.3%/9.3% and 8.8%/17.4%/17.9%, respectively. Longer holding periods hurt IRRs. Private equity investors have been able to exploit low cost debt to finance large recapitalizations, while public companies have enjoyed unprecedented significant global liquidity flows and record stock prices.
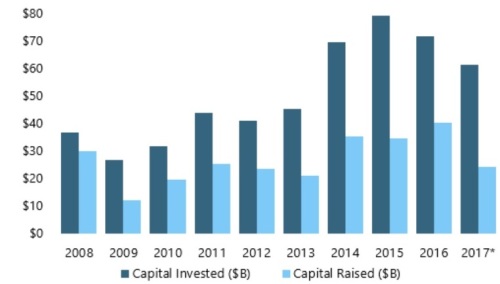
Despite generally robust venture capital distributions over the last several years, the venture industry in 3Q17 only raised $5.3 billion across 34 funds, which was significantly below the 2Q17 pace of $10.9 billion across 60 funds. Average fund size in 2017 to-date is $156 million while the median is only $60 million, indicating that a relatively small number of very large funds were raised. In fact, of the 157 funds raised in 2017 so far, 68 have been below $50 million in size with another 26 between $50 – $100 million; 10 funds were greater than $500 million. There were only 25 first-time funds, underscoring again that the venture industry continues to consolidate around a relatively small number of larger firms.
The “Funding Gap” is alive and well. The amount of capital invested continues to meaningfully outstrip the amount venture funds raise, showing that there are other types of investors piling in to fill the gap. Optimistically, one might argue that the venture investors are getting great leverage on their early stage dollars. On the other hand, the pessimist might argue that, once the music stops, non-venture investors will return from whence they came, leaving many venture-backed companies hung up and dependent on a relatively small set of investors. Given that the current economic expansion is now over 100 months old, and the average expansion lasts only 58 months, the optimist may be looking over his/her shoulder.
There are always a number of other nuggets in the quarterly funding data that are worth flagging, which provide additional commentary on the current state of the venture capital industry.
- California continues to be the most active state (it’s also one of the largest geographies) with 580 financings in 3Q17 accounting for $8.7 billion ($15 million average deal size) as compared to New York (#2) with 188 and $5.1 billion ($27 million average – WeWork effect?) and Massachusetts (#3) with 121 and $2.6 billion ($21 million average – biotech effect?)
- All other states combined were $5.1 billion across 817 companies ($6 million average – really capital efficient) further underscoring the capital concentration concerns
- The Top Ten financings captured $5.9 billion which means 0.6% of the companies accounted for 27% of the capital invested; all of those companies were in California, New York or Massachusetts except for one (Vets First Choice, which is in Portland, ME, which is kind of northern Massachusetts)
- Secondary funds raised $29 billion year-to-date, per Preqin, with another 44 funds in market to raise $31 billion, which signifies greater liquidity for LPs as well as suggesting a level of maturity to the private capital markets
- Per PitchBook, this past quarter debt-to-EBITDA levels in the buyout world hit 5.8x which is the highest levels in the last ten years….hmmm.
